
Indicators are commonly used to reflect the overall health of an economy. They also serve as key information for analysts to forecast economic directions and future investment possibilities. In this article, we set focus on common lagging indicators and what do they mean to you and your investments.
Broadly, there are three types of economic indicators - leading indicators, coincident indicators, and lagging indicators and we take an interest in the last category, lagging indicators.
- Leading indicators
Leading indicators offer insights into the next phase of the economic cycle. For example, when the economy exits or enters a recession, leading indicators – like a plant’s green shoots - are the first signs to emerge. They do not guarantee that a trend will form – but only suggest that conditions are as such.
- Coincident indicators
These signals reflect the current economic situation at any one point in time and do not predict nor confirm any economic direction.
- Lagging indicators
Lagging indicators are the opposite of leading, they highlight established economic patterns. Such hindsight is useful for planning purposes and can guide investors on their next course of action.
Out of all lagging indicators, there are three common ones – GDP, Inflation and Policy Rates.
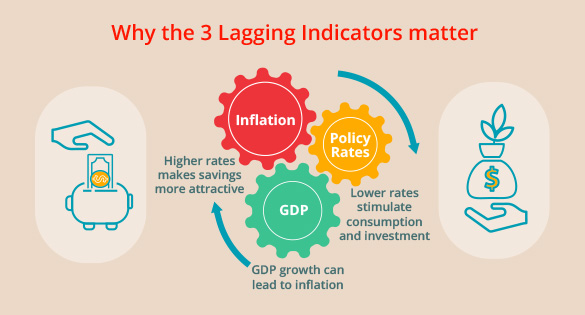
These three lagging indicators are interlinked. Understanding how the three indicators are correlated, and their impact on investment assets, will allow you to navigate different market scenarios while identifying potential investment opportunities.
For example, when inflation hits an economy, the central bank may increase policy rates thus making savings more attractive for individuals and businesses. This impacts GDP.
Likewise, when the economy faces recession headwinds and unemployment goes up, the central bank may lower policy rates to spur borrowing, to stimulate consumption and investments, benefitting GDP. Now let’s examine each indicator in greater details:
- Gross Domestic Product (GDP)
The GDP is one of the most widely used indicators for overall economic performance. It is calculated by summing up all the money spent by consumers, businesses, and the government in a specific period.
GDP fluctuations can be used to determine the rate at which economic development occurs. Generally, GDP increases in tandem with private consumption, government spending, and investment activities, along with an increase in exports, or a dip in imports.When governments spend more as an attempt to revive an economic downturn, the focus of their intiative may present investing opportunities. For example, greater government spending on transport infrastructure suggests investment opportunities in companies that build roads and railways. Speak to your Relationship Manager to help you identify opportunities, regardless of whether GDP is growing or shrinking.
What should an investor look out for when GDP increase?
By paying attention to the factors or industries that contribute to GDP growth, we can seize the opportunity to invest in the relevant industries or sectors that ride on the economic growth. It is useful to note that some of the factors used to calculate GDP, i.e., investments, exports, and imports, mean that the investment opportunities arising from GDP growth are not restricted to a specific country or market, but can be global.
- Inflation
The Consumer Price Index (CPI) measures price changes paid by consumers for a representative basket of goods and services, and the difference in the current month’s CPI and the CPI of the same month last year is known as the inflation rate.
The worst global inflation of recent years was seen in Venezuela, which experienced an inflation rate of 65,000% from 2017 to 2018. This means that an item which cost one dollar six months ago would now cost 65,000 dollars.
The Venezuela example shows that inflation reduces the purchasing power of your money: what you can buy for $1 today may cost $2 a year later. If the inflation rate outpaces that of salary increments, then it results in salary reductions. Inflation does not impact only individuals – a $100 million commitment a year ago to build a factory may cost more, now due to inflation.
What should an investor consider in an inflationary environment?
During an inflationary period, investors may consider inflation-resistant assets such as gold, instead of holding onto cash. - Policy Rate
Policy rate is an interest rate determined by the central bank when lending money to commercial banks. This determines the bank’s cost of funding, influencing their lending rates to businesses and consumers. The central bank raises the rate to reduce economic activities and curb inflation, while a reduction makes borrowing more affordable to spur spending.
What should an investor look out for?
In a rising rate environment, the overall stock market is likely to fall. When this happens, investors tend to embrace haven assets such as gold.
Avoid sectors that are likely to experience slowing demand, such as commodities, retail, and manufacturing, and companies that rely heavily on borrowing for business development.
However, financial services institutions that provide loans, such as banks, will benefit from higher interest rates.
While economic indicators offer insights and directions, investors should not respond nor make any investment decision solely on the movement of one indicator. Speak to your Relationship Manager for tailored portfolio solutions that suit your needs.
Contact Us
to get a personalized wealth management strategy communicated consistently to you.
to enjoy 24/7 end-to-end transactions